How Is an Automotive Life-Cycle Carbon Footprint Calculated?
Published: October 4, 2026 • Reading Time: 7 min • Last Updated: October 4, 2026
A vehicle’s carbon footprint extends beyond tailpipe emissions. It can cover materials and manufacturing, fuel or electricity supply, driving, and end-of-life treatment. This guide explains how analysts set boundaries, collect data, calculate CO₂e, and interpret results fairly.
Contents
- What does a life-cycle carbon footprint measure?
- The main calculation steps
- 1. Define the purpose and system boundary
- 2. Choose a functional unit
- 3. Build a life-cycle inventory
- 4. Convert emissions to CO₂e and add the stages
- Which life-cycle stages matter?
- Raw materials and manufacturing
- Fuel and electricity supply
- Vehicle use and end of life
- Comparing electric, hybrid and combustion vehicles
- Questions to ask when reading a result
- What this means for driving and rental planning
- Frequently asked questions
- Are tailpipe emissions the same as a carbon footprint?
- Does an electric vehicle have zero use-stage emissions?
- How does battery production affect the result?
- How should I compare two vehicle footprint figures?
- Conclusion: read the scope before the number
An automotive life-cycle carbon footprint describes climate emissions associated with a vehicle across a defined set of stages, rather than only the gases released from its exhaust. This guide explains how a study sets its boundaries, what information it needs, how emissions are expressed, and what to check before comparing results for different vehicles.
What does a life-cycle carbon footprint measure?
A carbon footprint is the total greenhouse gas emissions and, where relevant, removals within a defined system, expressed as carbon dioxide equivalents (CO₂e). CO₂e provides a common unit for comparing the climate effects of gases such as carbon dioxide, methane and nitrous oxide. A product carbon footprint is the climate-change portion of a life-cycle assessment; it does not by itself describe every environmental effect, such as water use or air pollution.
A vehicle study may include extraction and processing of materials, parts and vehicle manufacturing, production and delivery of fuel or electricity, vehicle use, and end-of-life treatment. The study must state what it includes. A calculation ending when a vehicle leaves the factory is a partial footprint; it cannot be treated as equivalent to a cradle-to-grave result that covers the vehicle’s defined life through end of life.
The main calculation steps
1. Define the purpose and system boundary
Start by stating the question: is the aim to estimate total emissions for a vehicle over its assumed life, emissions per kilometre, or emissions for a particular period of service? Then list the processes included and excluded. Manufacturing, energy supply, maintenance, replacement parts, recycling and disposal may be treated differently depending on the study’s scope.
A result may be specific to a model year, production location, electricity mix or assumed vehicle lifetime. A study based on another region’s electricity supply does not automatically represent charging in a different country. Read the context and boundary alongside the headline number.
2. Choose a functional unit
The functional unit is the common measure used to compare vehicles while representing the service being provided. Studies may report total emissions over a vehicle lifetime, emissions per vehicle-kilometre, or another defined unit of transport. A total per vehicle answers a different question from a per-kilometre figure. When results are divided by distance, the assumed lifetime distance matters: changing it also changes how manufacturing emissions are distributed across each kilometre.
3. Build a life-cycle inventory
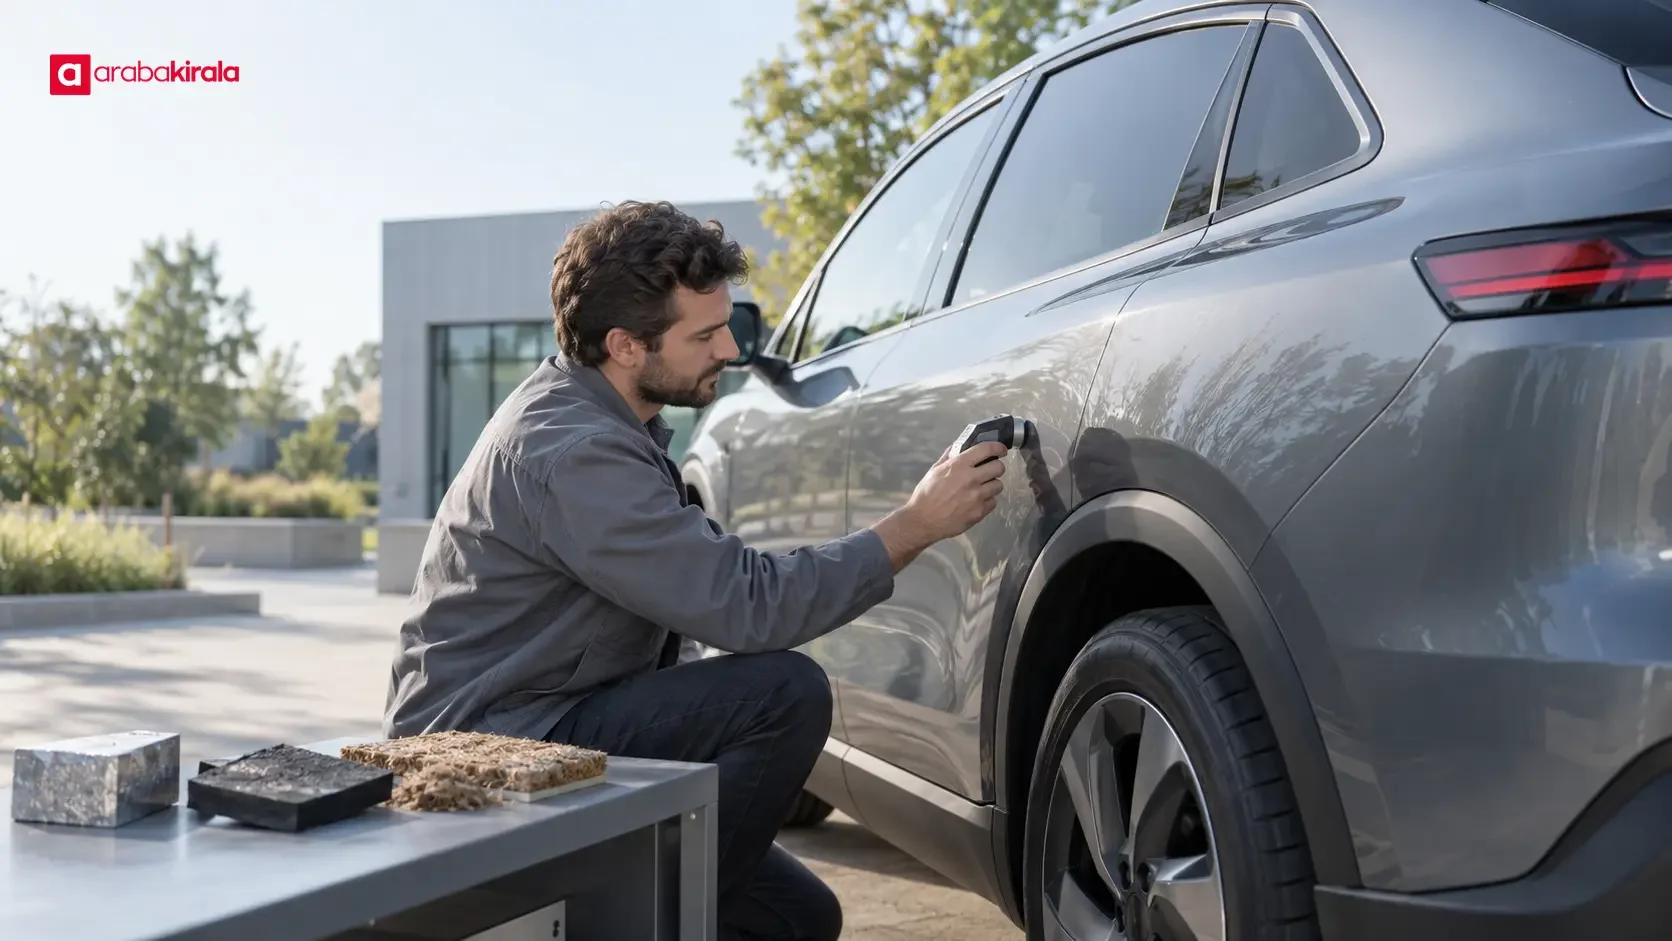
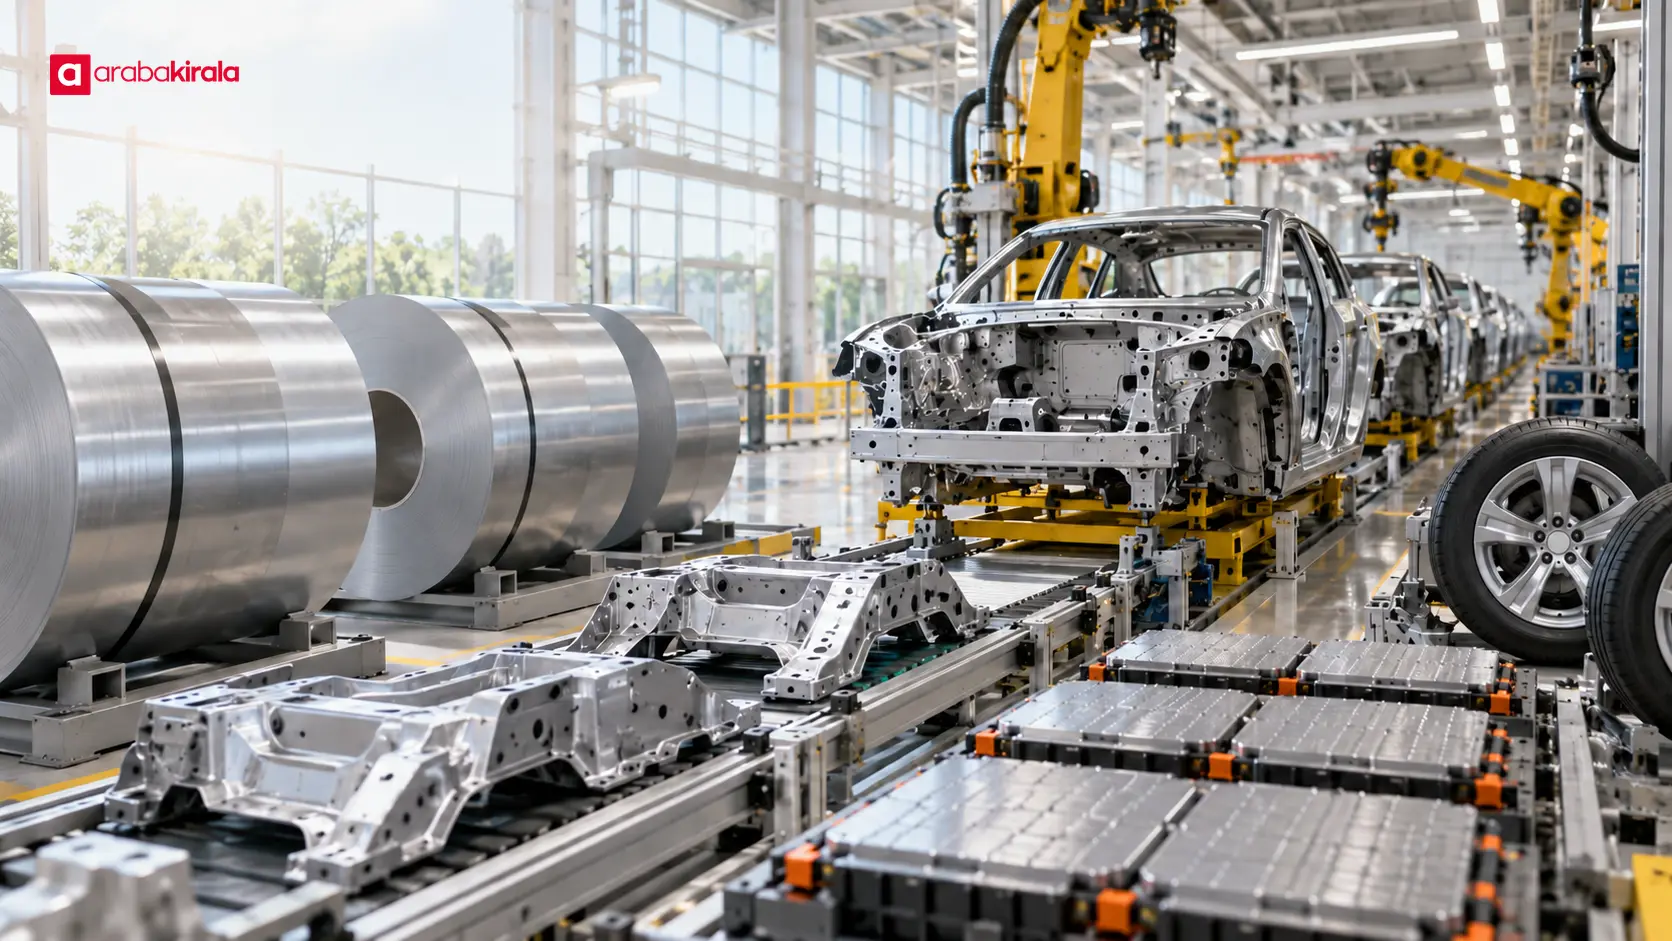
The inventory records the materials, energy and other relevant inputs at each included stage, together with associated greenhouse gas emissions. Manufacturing data can cover steel, aluminium, plastics, electronics, powertrain components and, for electric vehicles, batteries. Use-stage information includes fuel or electricity consumption, distance travelled and the emissions intensity of energy supply. Maintenance and replacement components can be included if they fall within the stated scope. End-of-life data may describe dismantling, reuse, recycling or disposal.
Data quality varies. Model- and site-specific measurements can be more representative than broad averages, but may not always be available or independently verified. When estimates or secondary data are used, a credible study identifies their source, date and geographic coverage. Missing information should be treated transparently as uncertainty rather than presented as a precise observation.
4. Convert emissions to CO₂e and add the stages
Activity data are paired with appropriate emission factors. In a simplified example, the quantity of fuel or electricity is multiplied by the factor associated with its supply and use; materials and manufacturing processes require their own relevant factors. Different greenhouse gases are converted into CO₂e using specified global-warming-potential values. The study then adds the results for all processes inside its boundary.
There is no single universal vehicle-footprint formula that produces a context-free answer. Vehicle type, production location, energy mix, measurement approach, assumed service life and recycling method can all affect the result. A number published without its method or emission-factor version is difficult to audit or compare.
Which life-cycle stages matter?
Raw materials and manufacturing
Extracting and processing materials such as steel, aluminium and plastics uses energy. Parts production and vehicle assembly also involve energy and industrial processes. For electric vehicles, battery production can be assessed as a distinct manufacturing component. Relevant information may include battery materials, production energy and the electricity mix at the manufacturing location. A footprint that stops at this stage says nothing by itself about emissions during driving.
Fuel and electricity supply
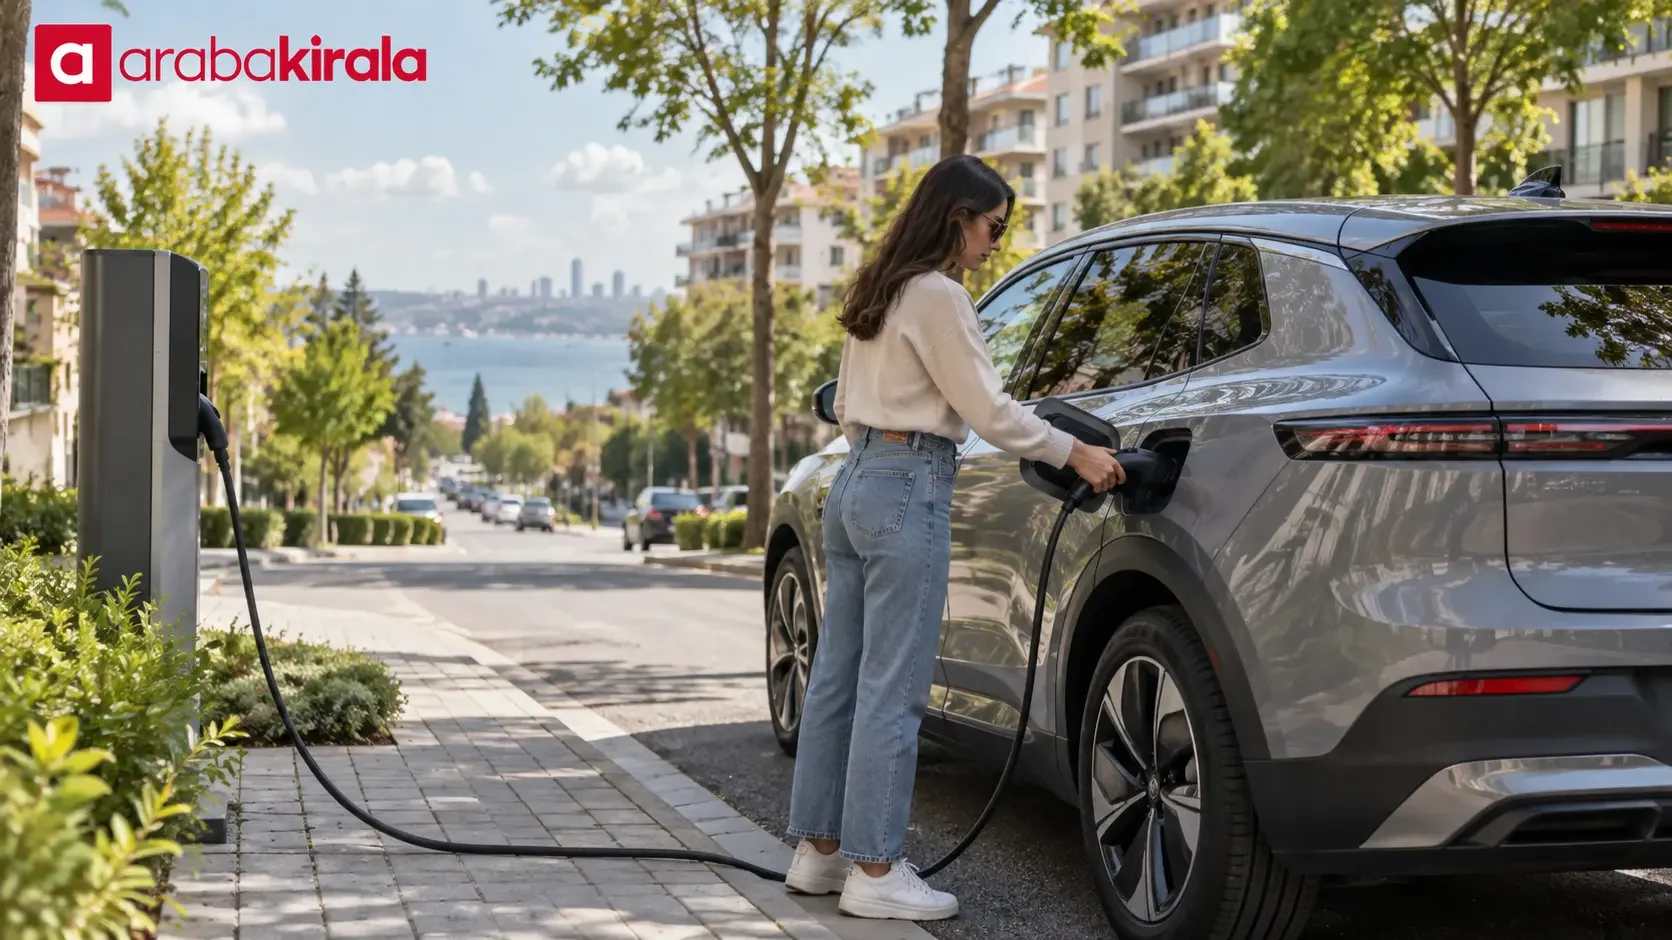
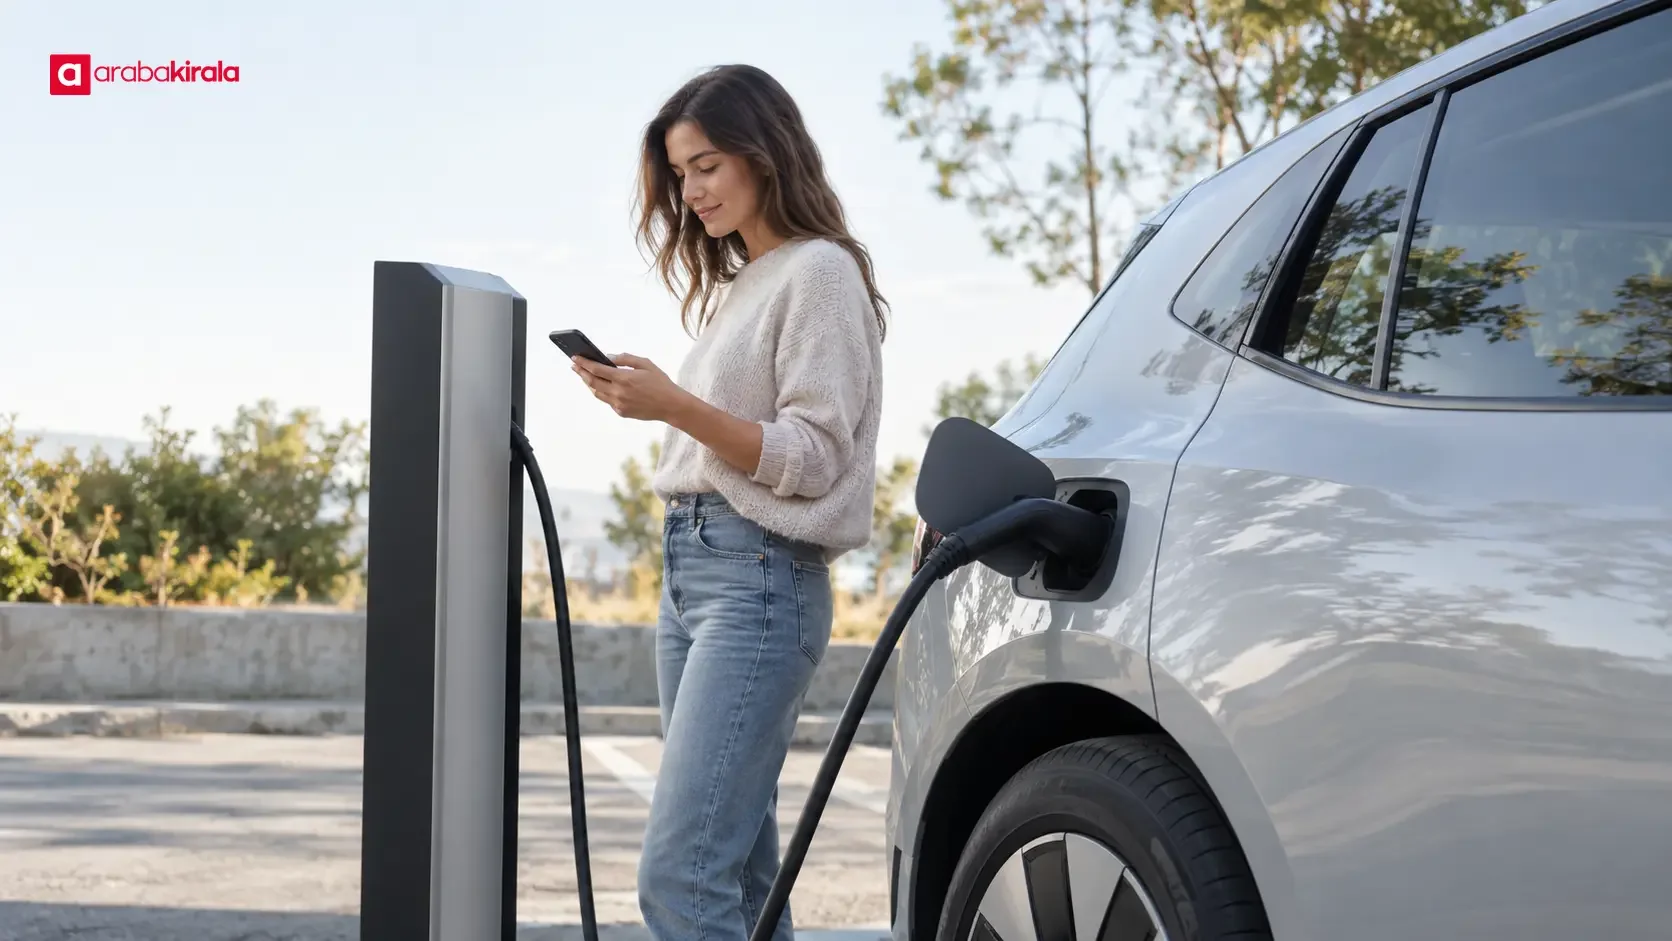
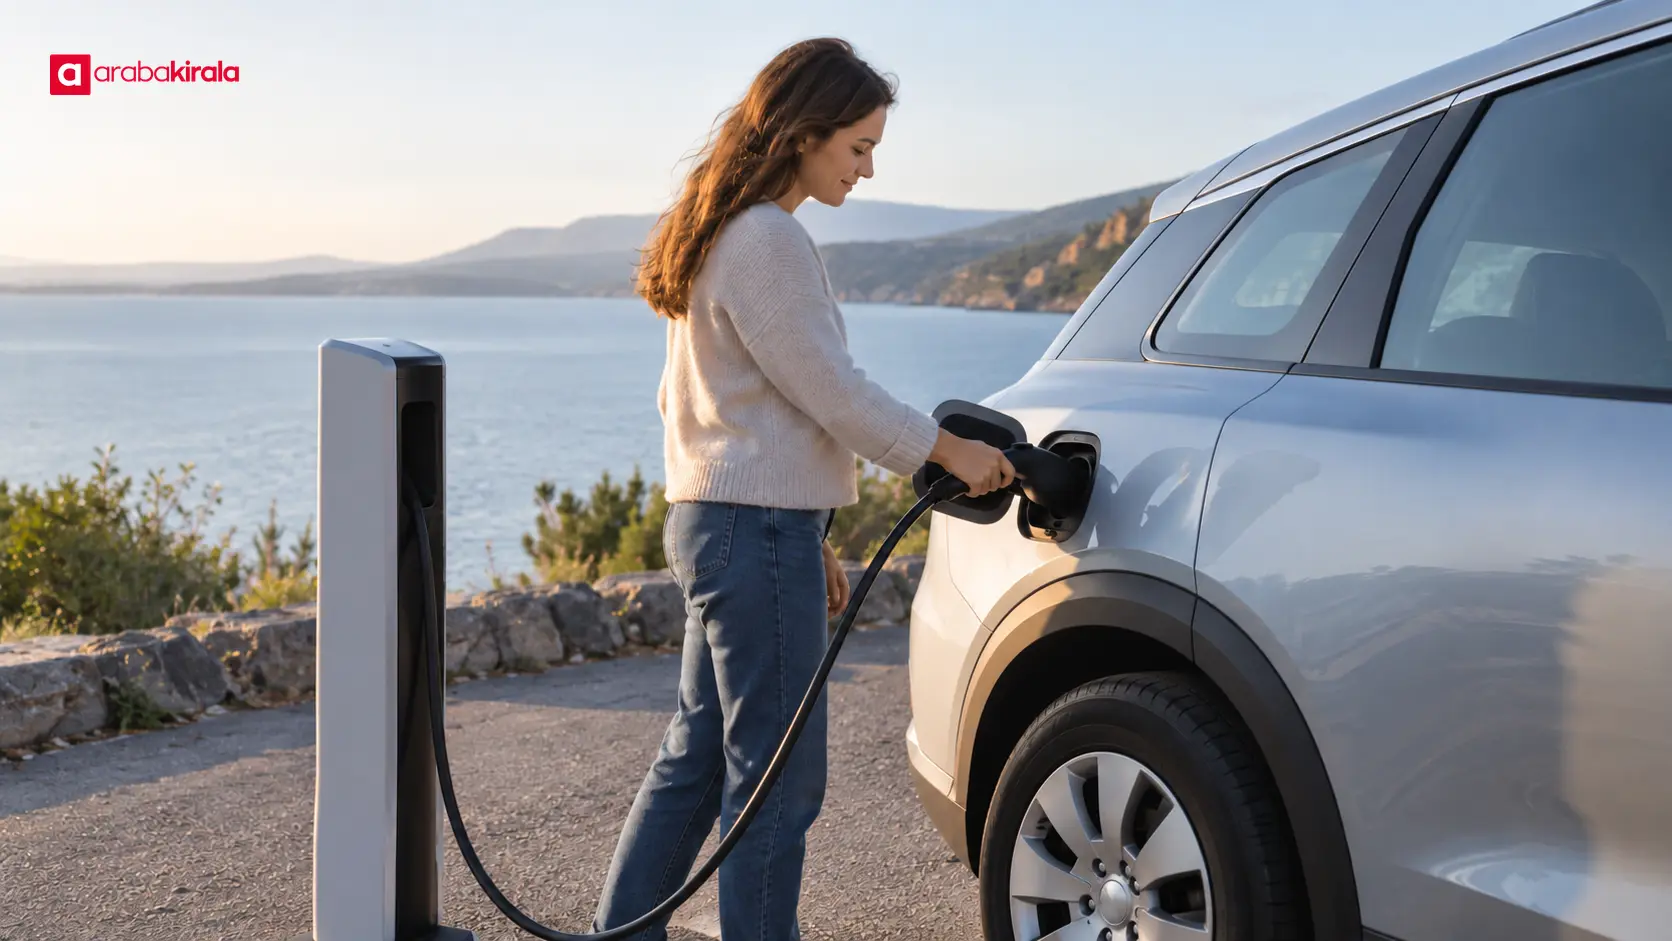
Tailpipe emissions refer to direct emissions released when fuel is burned in a vehicle. Producing that fuel also involves extraction, refining and transport. An electric vehicle has no tailpipe emissions while operating on electricity, but generating and delivering electricity can still cause emissions. It is therefore useful to distinguish an operational, vehicle-only calculation from an energy-supply assessment that traces fuel or electricity from its source to the vehicle.
Vehicle use and end of life
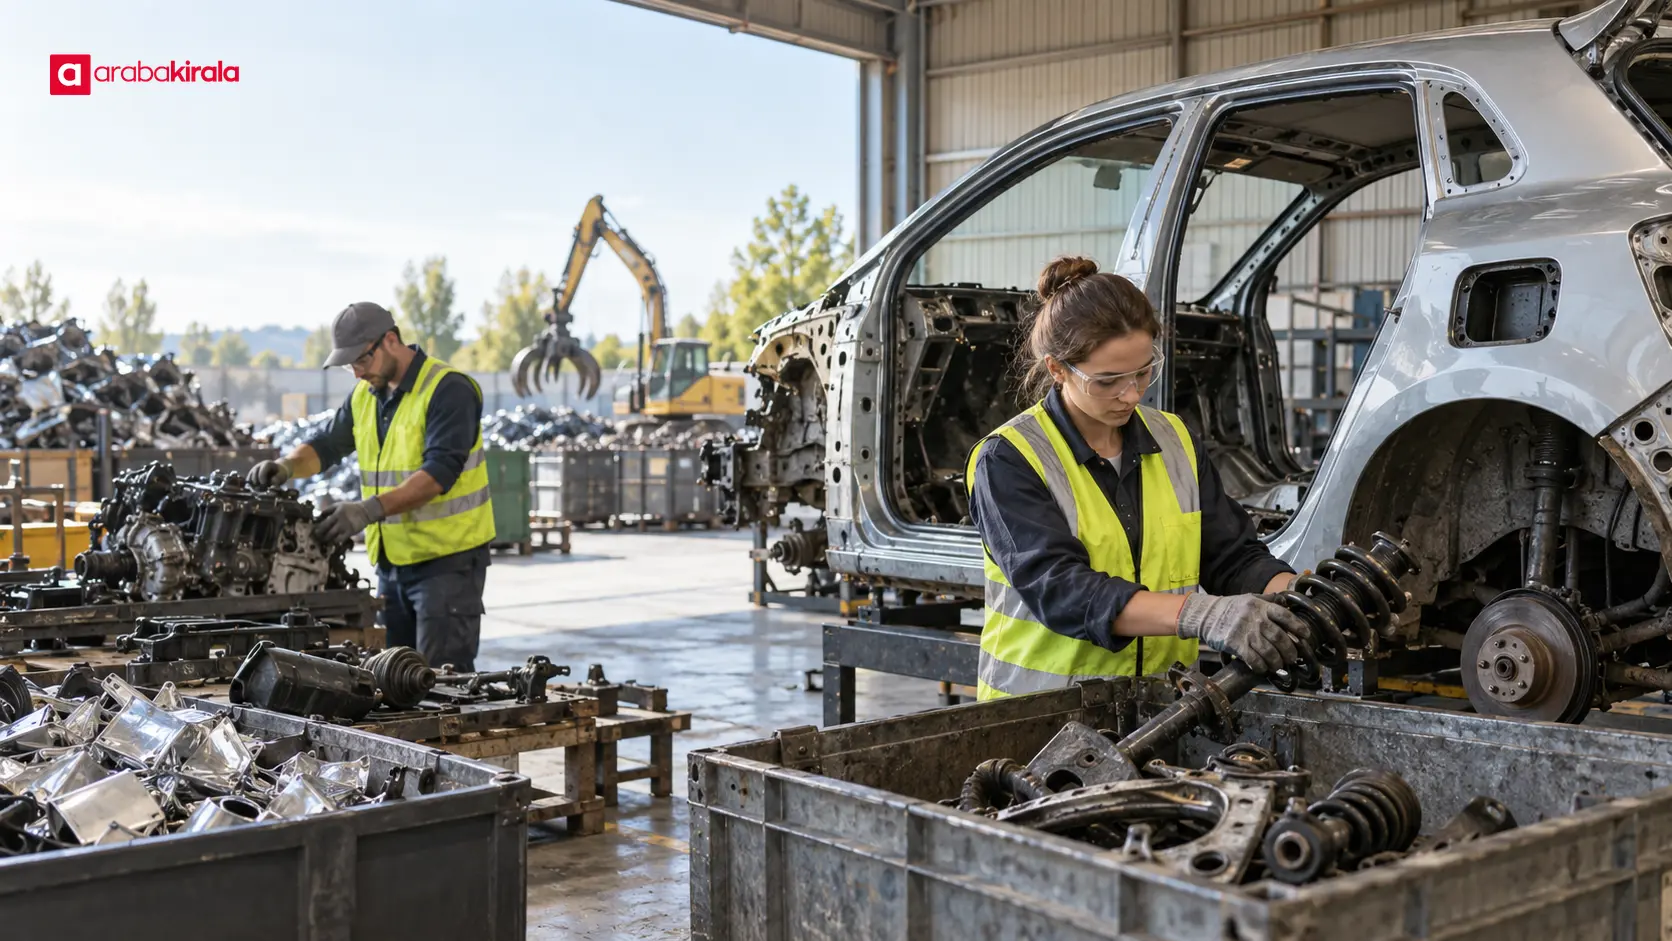
The use stage depends on the amount of fuel or electricity consumed and the distance driven. Driving conditions, speed, load and climate-control use can influence consumption, so the study should explain which consumption data it uses. At end of life, a study may account for dismantling, reuse of parts, material recovery and disposal. Allocation choices—such as which product receives credit for recycled material—can change the result and should be disclosed.
Comparing electric, hybrid and combustion vehicles
A fair comparison uses the same functional unit, comparable vehicle classes, consistent system boundaries and aligned lifetime assumptions. Looking only at tailpipe emissions leaves out manufacturing and energy supply for electric vehicles. Looking only at vehicle production leaves out fuel or electricity consumed during use. A broad result for one vehicle class, region or model year should not be assumed to apply to every vehicle or driver.
Look for the stages covered, vehicle and battery production data, fuel or electricity mix, source of consumption data, assumed lifetime distance, recycling approach and CO₂e unit. If a study claims to cover the vehicle from production to end of life, its boundary should reflect those stages. If it covers only selected stages, interpret it as a partial footprint.
Questions to ask when reading a result
- Is the result for the whole assumed vehicle life, or per kilometre?
- Which stages are included: materials, manufacturing, energy supply, use and end of life?
- Which country and period does the electricity mix or fuel supply data represent?
- What assumptions are used for lifetime distance, maintenance, replacement parts and recycling?
- Are the data measured or modelled, and does the study explain uncertainty?
These checks reveal what a value actually means instead of reducing it to a simple “low” or “high” label. A carbon-footprint result is not a full assessment of every environmental impact or a guaranteed estimate of one driver’s emissions.
What this means for driving and rental planning
A whole-vehicle life-cycle result does not directly calculate the footprint of a short rental trip. That requires additional assumptions, including the rental period, distance travelled, energy consumption and how the vehicle’s manufacturing impact is allocated. Choosing a vehicle size suited to the journey, avoiding unnecessary distance and driving smoothly are practical ways to avoid needless energy use, but they do not guarantee a specific emissions reduction.
Vehicle type, energy source, refuelling or charging arrangements, and equipment details can vary by rental location and reservation. Ask the branch you plan to rent from about the vehicle availability and practical steps relevant to your trip. That information alone does not establish a model’s life-cycle footprint; a technical comparison needs credible data prepared on a consistent basis.
Frequently asked questions
Are tailpipe emissions the same as a carbon footprint?
No. Tailpipe emissions cover direct gases released while a vehicle operates. A life-cycle footprint can also include manufacturing, energy supply and end-of-life processes, depending on the stated boundary.
Does an electric vehicle have zero use-stage emissions?
It has no exhaust emissions while running on electricity. Electricity generation and supply can still cause emissions, and a full life-cycle assessment may also include vehicle and battery production and end-of-life treatment.
How does battery production affect the result?
Battery production is one input to the vehicle manufacturing stage. Its contribution depends on the battery, production processes and energy sources involved. One generic figure cannot represent every vehicle; check whether studies being compared use the same scope and method.
How should I compare two vehicle footprint figures?
First align the unit, system boundary, vehicle class and use assumptions. If these differ, the numerical gap does not necessarily show that the vehicles will differ by the same amount in real-world use.
Conclusion: read the scope before the number
An automotive life-cycle carbon footprint brings materials and vehicle production, fuel or electricity supply, use and end-of-life treatment together within a defined boundary. A useful calculation makes its purpose, functional unit, inventory data, emission factors and assumptions clear. When reviewing a report, check which stages it covers and the conditions it represents. For a vehicle or rental plan, identify the energy type and vehicle you need, then ask the location you will rent from about branch-specific practical details.
Legal Disclaimer: All content, articles and information on the Araba Kirala website are provided solely to inform users. No information shared on this website constitutes definitive advice or guidance. Araba Kirala Teknoloji A.Ş. and its authors cannot be held responsible for any direct or indirect damages arising from the application of information on the website. For all questions and requests regarding car rental, please contact the office from which you will rent your vehicle.